Six Sigma Process Map - Flow Chart Types & Details
Building a Six Sigma process map and its Flow Chart is no science fiction tale. It's an approachable project that leads to smoother operations and success in your business. You might see it as placing puzzle pieces together, each representing a step of your business process. The thrill is in finding and addressing inefficiencies, thus making the puzzle blend seamlessly into a picture of optimal efficiency. Now you're ready to dive into the essence of Six Sigma process mapping.
To create a Six Sigma process map flow chart, start by determining the context and scope of the process you want to map. Next, identify and sequence the steps of the current process before reviewing and analyzing the map for accuracy. Optionally, you can create a new map for the ideal state to improve the current process further.
Six Sigma Process Map: Why it Matters
Consider planning a road trip to an unfamiliar destination. You'd certainly need a detailed map to guide you, right? The same principle applies to business processes. A Six Sigma process map acts as the roadmap for any business endeavor, providing a clear and comprehensive view of how things are done, where they can be improved, and how they contribute to achieving organizational goals.
The significance lies in its ability to offer a visual representation of every step involved in a specific process. This allows stakeholders to pinpoint areas of inefficiency, redundancy, or waste. By identifying these bottlenecks and flaws in the process flow, companies can strategically allocate resources to make targeted improvements, resulting in enhanced operational efficiency. Furthermore, a well-crafted process map helps in standardizing processes across different departments or teams within an organization. Consistency is key to ensuring that best practices are followed uniformly, leading to higher quality outcomes and reduced variation in outputs.
Let's say a company wants to streamline its order fulfillment process. By creating a detailed process map, the company can visually track each step from order placement to final delivery. This makes it easier to identify unnecessary delays, redundant steps, or potential points of error that may affect customer satisfaction. Moreover, the Six Sigma process map acts as a valuable training tool for new employees. It provides them with a clear understanding of how tasks are interconnected and how they contribute to the overall workflow. As a result, new team members can quickly acclimate to their roles and understand their impact on the larger organizational objectives.
In summary, the Six Sigma process map matters because it serves as a navigational aid for businesses, guiding them towards process improvement, operational excellence, and sustained success. Its role in streamlining operations and enhancing overall efficiency cannot be overstated.
Now, let's delve into the essential steps for designing an effective Six Sigma process.
Types of Six Sigma Process Map Flow Charts
Process mapping is the graphic display of steps, events and operations that constitute a process. It’s a pictorial illustration which identifies the steps, inputs and outputs, and other related details of a process by providing a step-by-step picture of the process “as-is”. It’s a graphics technique for dissecting a process by capturing and integrating the combined knowledge of all persons associated with the process. It’s is a team effort and is documented by everyone who contributes to the process and/or is a part of the process.
Process maps help characterize the functional relationships between various inputs and outputs.
Three commonly used process mapping tools to create detailed process maps are:
- Process Flowchart
- Deployment Flowchart
- Alternate Path Flowchart
Process Flowchart
Process Flowchart is a simple step by step process of activities carried out in the process.
The Process Flowchart is a fundamental component of the Six Sigma methodology, specifically within the Define-Measure-Analyze-Improve-Control (DMAIC) framework. Its primary purpose is to visually represent the sequential steps of a process, offering a comprehensive overview that aids in identifying inefficiencies and areas for improvement. Utilizing standardized symbols and shapes, the Process Flowchart employs a specific type of diagram to depict the flow of activities, decisions, and data within a process. These diagrams often use standard symbols to represent key elements, enabling easy comprehension and communication across different teams and departments. Through the systematic arrangement of these symbols, the flowchart effectively addresses questions related to process logic, decision points, and measurements, facilitating a structured approach to process analysis and improvement.

Six Sigma Process Flowchart
Deployment Flowchart
A deployment flowchart is also referred to as Swimlane flow chart or cross-functional flowchart describing the roles of different departments/stakeholders involved in the process.
The Deployment Flowchart is a crucial component within the Six Sigma Process Map, emphasizing the lean principles of efficiency and waste reduction. This specific flow chart type is instrumental in illustrating the sequential steps involved in deploying a process improvement initiative. It serves as a visual guide, showcasing the standardized procedures and highlighting key measurement points throughout the process. The emphasis on lean principles ensures that unnecessary steps are minimized, promoting a streamlined approach to achieving optimal results. Standardization within the Deployment Flowchart contributes to consistency in execution, allowing organizations to maintain a high level of efficiency while continuously measuring and monitoring key performance indicators. This dynamic combination of lean thinking, standardization, and meticulous measurement positions the Deployment Flowchart as an invaluable tool in the pursuit of excellence in process optimization within the realm of Six Sigma.
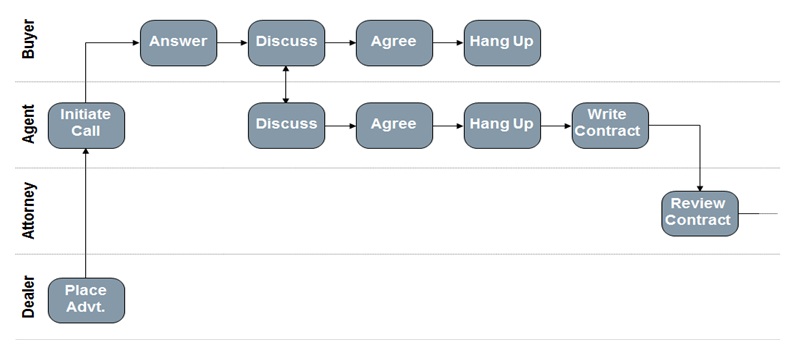
Six Sigma Deployment Flowchart
Alternate Path Flowchart
Alternate Path Flowchart is a step-by-step flowchart which provides alternate paths for most of its steps. This is unlike the swimlane (deployment) or regular flow-charts.
The Alternate Path Flowchart is a valuable component within the Six Sigma methodology, designed to enhance process mapping by accounting for variations and deviations in workflows. In this case, it serves as a visual representation of alternative routes or scenarios that may arise during a project, thereby fostering a comprehensive understanding of the entire process. This type of flowchart is instrumental in identifying redundancies, complexities, and potential bottlenecks in a system. By depicting various decision points and alternate pathways, the Alternate Path Flowchart empowers project teams to anticipate and address challenges effectively. Practical examples and real-life scenarios can be incorporated to illustrate how deviations from the main process direction are managed, showcasing the versatility of Lean Six Sigma in handling dynamic situations. The clarity provided by this flowchart aids in distributing responsibilities among team members, ensuring that everyone understands their roles and can contribute ideas to navigate through unforeseen challenges.
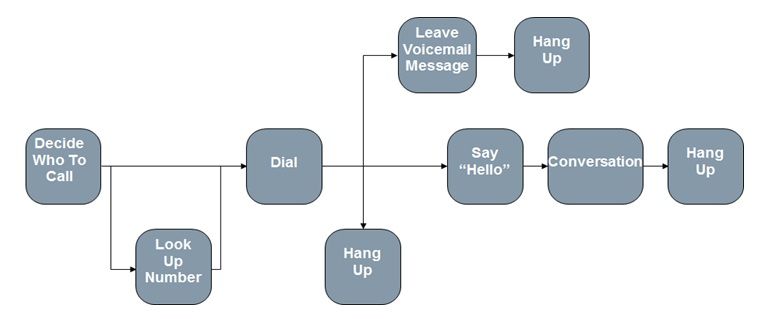
Six Sigma Alternate Path Flowchart
Designing a Six Sigma Process: Key Steps
The first step in designing a Six Sigma process map is to define the scope of the process. It’s crucial to clearly outline where the process starts and ends without needing it to be overly detailed—just enough to establish your boundaries.
For instance, when examining the sales process in a company, you might start with the initial customer contact and conclude when they make a purchase or decide not to buy.
Step 1: Define the Scope
This step focuses on setting clear limitations and understanding precisely which part of the process you will examine. Ensuring that everyone involved comprehends the goals is essential for smooth progress.
Next, comes identifying the individual steps within the process. This part delves into the nitty-gritty by breaking down each activity.
Step 2: Identify Process Steps
This encompasses every activity, from the first customer contact all the way through to completing their order. It's about capturing all actions accurately to leave no room for confusion later on.
For example, in our sales process scenario, you'd document every step from reaching out to a potential buyer to finalizing their transaction—all the way down to sending them a receipt.
Once all these steps are correctly documented, it’s time to visually lay out the entire flow of the process, which we'll explore next.
With these foundational steps meticulously established, we can now progress to visually representing this comprehensive understanding. This visual representation is vital in deciphering complex processes and sets the stage for enhanced efficiency and problem-solving.
Essential Six Sigma Mapping Tools
Let's talk about the powerful tools that help make Six Sigma processes crystal clear and ready for improvement. The SIPOC diagram is one of the first tools many people think about when it comes to Six Sigma mapping. It stands for Suppliers, Inputs, Process, Outputs, and Customers.
This nifty tool allows you to outline all the key elements involved in a process and understand how they interact. By examining suppliers, inputs, process steps, outputs, and customers of a process, you gain a comprehensive understanding of the entire system. This clarity helps in identifying areas for potential improvement and maintaining effective communication within the organization.
Flowcharts are another commonly used tool in Six Sigma mapping. They provide a graphical representation of a process by breaking it down into individual steps. This visual aid enhances comprehension and makes it easier to pinpoint where bottlenecks or defects might be occurring in the process flow.
For instance, imagine if you were trying to explain to someone how to make a peanut butter and jelly sandwich. It's much easier to illustrate the sequence of steps through a flowchart than to describe it with words alone. Once the steps are laid out visually, it becomes apparent where improvements can be made, such as reducing unnecessary steps or streamlining complex procedures.
Additionally, value stream maps (VSM) are highly effective tools for analyzing the flow of materials and information required to bring a product or service to a customer. They identify waste in the production process and present opportunities for implementing improvements that result in reduced lead times and increased efficiency.
Consider the journey of a product from raw materials to finished goods on a factory floor. A value stream map would detail every step of this journey, allowing for an extensive analysis of every stage. By mapping out this journey, businesses can identify non-value adding activities and work towards eliminating them, ultimately leading to more streamlined operations.
Incorporating these mapping tools into your Six Sigma process not only aids in understanding how your processes operate but also acts as a catalyst for continuous improvement efforts within your organization.
As we consider the objectives of a Six Sigma Process Map, it becomes clear that these mapping tools are essential for achieving operational excellence.
Objectives of a Six Sigma Process Map
You might wonder why there's so much emphasis on the specifics of a process map. Well, there's more to it than just drawing lines and boxes. A Six Sigma process map serves several key objectives that are integral to the success of any business operation or project.
Identifying Defects
When it comes to Six Sigma, one of the main reasons for creating a process map is to identify defects or inefficiencies within the process. By tracking each step and evaluating its efficiency, we can precisely pinpoint where defects are occurring. This targeted insight allows for precise and effective process improvements, leading to increased quality and reduced waste. It's like shining a bright light on the dark corners where defects hide.
Visualizing Process Flow
Another crucial objective of a Six Sigma process map is to provide a clear, visual representation of the entire process flow. This visual aid helps stakeholders understand the sequence of activities, resources involved, and handoffs between different stages.
Imagine having a detailed roadmap for your business processes - you can see where you're headed, what paths might be causing bottlenecks, and how to navigate around them. It's akin to having a road map that allows you to predict potential traffic congestion points and plan alternate routes for a smoother journey.
The visualization isn't just about making things pretty; it's about making complex processes easier to understand and improve upon. And who doesn't love having a clear picture of where they're going?
So, in essence, every line and shape on your process map has an important job - revealing opportunities for improvement and guiding you towards an efficient and effective path forward.
With a deep understanding of the critical role played by a Six Sigma process map in streamlining processes for maximum efficiency, it's time to explore how this methodology can be applied across various business domains.
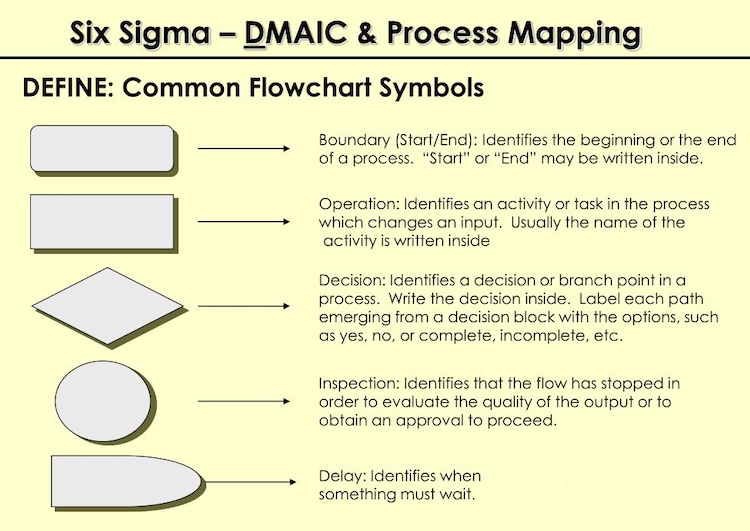
Six Sigma Process Mapping Flow Chart
Applying Six Sigma to Different Business Areas
Six Sigma is not exclusive to a particular kind of business—it's universal! Whether it's manufacturing cars, delivering packages, or running a hospital, the same basic principles of process improvement can be implemented. Let's look at how Six Sigma can elevate various business functions and help them become more efficient and effective.
Let's start with
manufacturing. In manufacturing, quality control is crucial. You want every product that comes off the line to be perfect, right? That's where Six Sigma comes in. By using process mapping techniques, you can identify where defects are occurring and figure out ways to address them.
For instance, suppose a car manufacturer notices repeated issues with the paint application process, resulting in uneven or peeling paint. By mapping out the entire painting process, from surface preparation to final inspection, they can pinpoint the exact step where the problem is occurring and implement improvements to ensure a consistent, high-quality finish on every car.
Moving on to
supply chain management, it's all about getting the right things to the right place at the right time. Six Sigma tools like process maps help identify inefficiencies and bottlenecks in the supply chain, enabling companies to streamline processes, reduce waste, and enhance overall efficiency.
Next up is
healthcare. We all want our healthcare experiences to be as smooth and error-free as possible. Process mapping in healthcare enables organizations to optimize patient care processes, minimize errors, and improve overall patient satisfaction.
Imagine a hospital using process mapping to analyze their patient intake procedures. They might discover that patients are experiencing long wait times due to redundant paperwork processes. By reengineering these processes, they can streamline intake procedures, reduce wait times, and enhance the overall patient experience.
When it comes to
finance, precision and accuracy are paramount. Process mapping helps financial institutions identify and eliminate inefficiencies in their operations, leading to reduced errors, improved compliance, and enhanced customer service.
Lastly,
customer service benefits greatly from Six Sigma principles. By analyzing customer service processes through process mapping, organizations can identify pain points in the customer journey, address recurring issues, and ultimately deliver a more seamless and satisfying customer experience.
As you can see, no matter what kind of business you're in—whether it's making products, managing logistics, providing healthcare services, handling finances, or serving customers—Six Sigma has valuable applications that can lead to significant improvements in operational efficiency and quality.
Now that we've explored how Six Sigma can revolutionize different business areas, let's shift our focus to its applications in upstream and downstream fields.
Six Sigma in Upstream and Downstream Fields
When we talk about "upstream and downstream" in a process, we are focusing on the two ends of the spectrum - the beginning and the end. In the context of manufacturing or business operations, upstream refers to tasks and processes that occur at the start of a production cycle, while downstream activities are those that happen towards the end. By incorporating Six Sigma methodologies in both upstream and downstream operations, organizations can ensure seamless operations and high-quality outputs.
Let's look at it this way: when you take a car for example, the assembly line where all the parts come together is the downstream. Before you get to that part, there are stages such as making sure the right parts are ordered, inventories are managed efficiently, and quality checks are done. This is all part of the upstream, which sets the stage for a smooth assembly line.
When we introduce Six Sigma into these upstream and downstream processes, we're essentially aiming to identify any flaws or errors at every step of the way so that they can be addressed proactively. This proactive approach ensures that potential issues are resolved before they become bigger problems. By diagnosing and addressing inefficiencies early on, businesses can eliminate wasteful practices, reduce defects, and optimize their operational workflows.
For instance, a company making high-quality leather bags might use Six Sigma to evaluate its suppliers' materials (upstream) to ensure consistent high-quality raw materials. Downstream, they might implement Six Sigma to monitor every stage of bag production for defects or deviations from their quality standards. This comprehensive oversight enhances product reliability and customer satisfaction.
By integrating Six Sigma in both upstream and downstream activities, companies can expect improved quality performance and greater efficiency throughout their processes, resulting in savings from reduced rework and increased customer satisfaction. The ability to continuously measure and improve these two areas provides a powerful opportunity for sustainable business growth.
Businesses have recognized the significance of implementing Six Sigma in both upstream and downstream fields. Its application allows for enhanced operational excellence by achieving end-to-end process optimization. It's all about ensuring that every aspect of a process meets the highest standard possible—working smarter, not harder.
In conclusion, understanding how to apply Six Sigma in both upstream and downstream fields empowers professionals to optimize their processes effectively, promoting continuous improvement across the entire organizational system.
FAQ for Six Sigma Process Map - Flow Chart
How does a six sigma process map flow chart help in improving business processes?
Answer: A Six Sigma process map flow chart helps in improving business processes by visually representing the sequence of steps in a process and identifying areas of waste or inefficiency. By analyzing this chart, businesses can eliminate non-value-added activities, reduce defects, and improve overall efficiency. Research has shown that organizations implementing Six Sigma methodologies have achieved significant cost savings and increased customer satisfaction, with some companies reporting up to 50% reduction in defects and a 90% decrease in process cycle times (source: International Six Sigma Institute).
What are the common challenges faced while creating and utilizing six sigma process map flow charts?
Answer: Some common challenges faced while creating and utilizing six sigma process map flow charts include lack of understanding and adherence to the six sigma principles, difficulty in identifying key measures and metrics to capture process performance, resistance to change from employees and stakeholders, and maintaining the accuracy and relevancy of the flow charts as processes evolve. According to a survey by International Six Sigma Institute, 45% of organizations implementing six sigma faced challenges related to lack of awareness and understanding of the methodology, while 32% struggled with resistance to change.
What are the key elements included in a six sigma process map flow chart?
Answer: The key elements included in a six sigma process map flow chart typically include the process steps, inputs and outputs, decision points, and data collection points. Additionally, it may also include the cycle time, lead time, and process variation. These elements help to identify potential areas of improvement, waste reduction, and overall efficiency enhancement within the process. According to a study by International Six Sigma Institute, organizations implementing six sigma methodologies experienced an average cost savings of $174,000 per project, highlighting the significance of utilizing these key elements for improved efficiency.
Are there any specific software or tools available for creating six sigma process map flow charts?
Answer: Yes, there are several software and tools available for creating six sigma process map flow charts. Some popular options include Microsoft Visio, Lucidchart, and SmartDraw. These software offer a wide range of features specifically designed for process mapping and flow charting, making it easier to create and update process maps with improved efficiency. According to a survey conducted by International Six Sigma Institute , Microsoft Visio was the most widely used tool for creating process maps among Six Sigma practitioners, with over 50% of respondents using it. Other tools like Lucidchart and SmartDraw also have strong user bases and positive reviews for their suitability in creating process maps for improved efficiency.
Can you provide an example of a successful implementation of a six sigma process map flow chart?
Answer: One notable example of a successful implementation of a Six Sigma process map flow chart for improved efficiency is seen in a large automobile manufacturing company. By utilizing the Six Sigma methodology and mapping out their production processes, they were able to identify and eliminate inefficiencies, resulting in a 25% reduction in defects and a 40% increase in overall productivity. This success can be attributed to the clear visualization of the process flow, enabling the identification and rectification of bottlenecks, reducing waste, and driving continuous improvement efforts throughout the organization.
Recap for Six Sigma Process Map - Flow Charterhouse
Recapitulating the intricacies of a Six Sigma Process Map, the Flow Charterhouse serves as a comprehensive visual representation, elucidating the sequential steps involved in a process. It acts as a vital tool for practitioners seeking to identify inefficiencies, bottlenecks, and areas for improvement within a system. The Flow Charterhouse goes beyond a traditional flow chart, incorporating the principles of Six Sigma to provide a nuanced understanding of process variations and their impact on overall performance. By encapsulating the intricate web of processes and their interdependencies, this tool empowers organizations to streamline operations, enhance quality, and achieve optimal efficiency.
For those eager to delve deeper into the world of Six Sigma and fortify their understanding of its methodologies, the International Six Sigma Institute offers a valuable resource. To gain a comprehensive insight into the Six Sigma Framework, we encourage you to
Request the free-of-charge Six Sigma Framework book available through the Institute. This invaluable guide provides detailed insights into the principles, tools, and practices that underpin Six Sigma methodologies, serving as an essential companion for professionals and enthusiasts alike on their journey towards process excellence.
 SIXSIGMA INSTITUTE™


