Six Sigma Hypothesis Testing: Results with P-Value & Data
Six Sigma Hypothesis Testing is a tool used in data analysis that inspects if a change made to a process has made it better or not. It does this through exploring two ideas known as the null hypothesis and the alternative hypothesis. Picture it like weighing scales: one side maintains that everything is normal (null hypothesis), while the other proposes there's been an improvement (alternative hypothesis). But here's a twist, these 'scales' aren't always evenly balanced. Sometimes, we face situations where the evidence leans more toward change, causing us to reject the null hypothesis. With this method, you can accurately predict if your production process changes are actually improvements. And so begins our analysis of this fascinating method.
Hypothesis testing is crucial in Six Sigma as it provides a statistical framework to analyze process improvements, measure project progress, and make data-driven decisions. By using hypothesis testing, Six Sigma practitioners can effectively determine whether changes made to a process have resulted in meaningful improvements or not, thus ensuring strategic decision-making based on evidence.
In the realm of Six Sigma hypothesis testing, the significance of P-data, or process data, cannot be overstated. P-data serves as the cornerstone for evaluating the effectiveness of process improvements and identifying potential areas for enhancement.
Through meticulous analysis of P-values and comprehensive examination of data patterns, organizations can derive valuable insights that guide informed decision-making, fostering a culture of continuous improvement and efficiency within their operational frameworks.
Six Sigma DMAIC - Analyze Phase - Hypothesis Testing
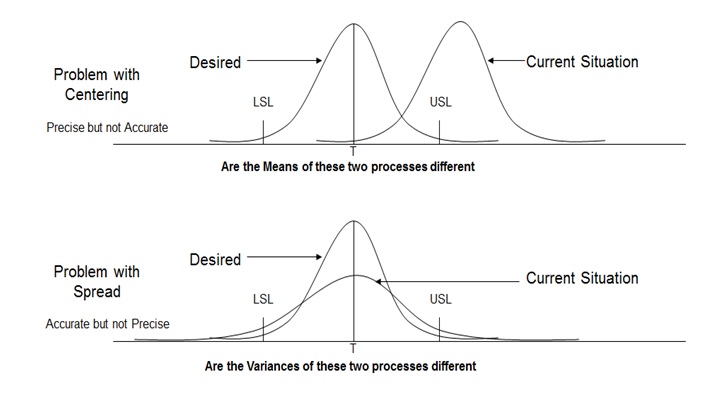
In a process, we may face Problem with Centering and/or Problem with Spread. Below diagram will allow us to understand these two problems in detail:
Practical Six Sigma Problems that require Hypothesis Testing
Hypothesis testing tells us whether there exists statistically significant difference between the data sets for us to consider that they represent different distributions.
What is the difference that can be detected using Hypothesis Testing?
For Continuous data, hypothesis testing can detect Difference in Average and Difference in Variance. For Discrete data, hypothesis testing can detect Difference in Proportion Defective.
Steps in Hypothesis Testing:
- Step 1: Determine appropriate Hypothesis test
- Step 2: State the Null Hypothesis Ho and Alternate Hypothesis Ha
- Step 3: Calculate Test Statistics / P-value against table value of test statistic
- Step 4: Interpret results – Accept or reject Ho
Mechanism:
- Ho = Null Hypothesis – There is No statistically significant difference between the two groups
- Ha = Alternate Hypothesis – There is statistically significant difference between the two groups
Hypothesis Testing Errors:
Type I Error – P (Reject Ho when Ho is true) = α
In type I Error, we reject the Null Hypothesis when it is true. It is also called as Alpha error or Producer’s Risk.
Type II Error - P (Accept Ho when Ho is false) = β
Similarly, in type II Error, we accept Null Hypothesis when it is false. It is also called as Beta error or Consumer’s Risk.
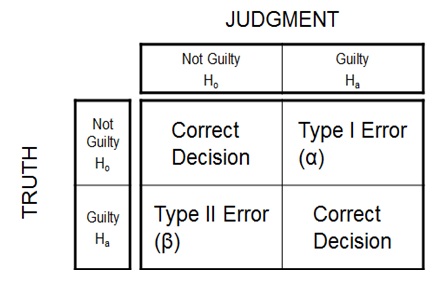
Six Sigma Hypothesis Testing Errors
P Value – Also known as Probability value, it is a statistical measure which indicates the probability of making an α error. The value ranges between 0 and 1. We normally work with 5% alpha risk, a p value lower than 0.05 means that we reject the Null hypothesis and accept alternate hypothesis.
Types of Hypothesis Testing:
We use the following grid to select the appropriate hypothesis test depending on the data types:
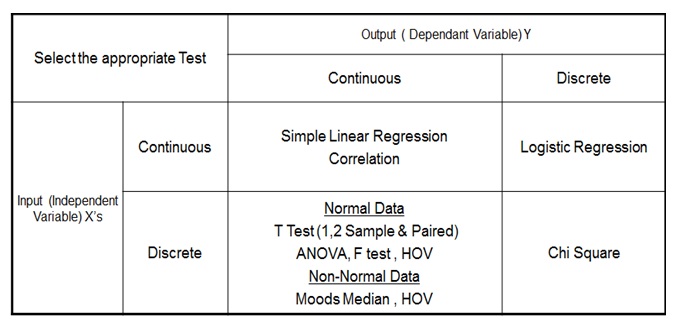
Types of Six Sigma Hypothesis Testing
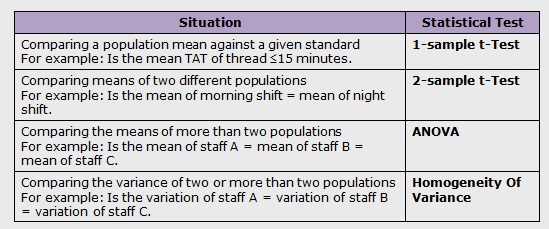
Normal Continuous Y and Discrete X

Non-Normal Continuous Y and Discrete X

Continuous Y and Continuous X

Discrete Y and Discrete X
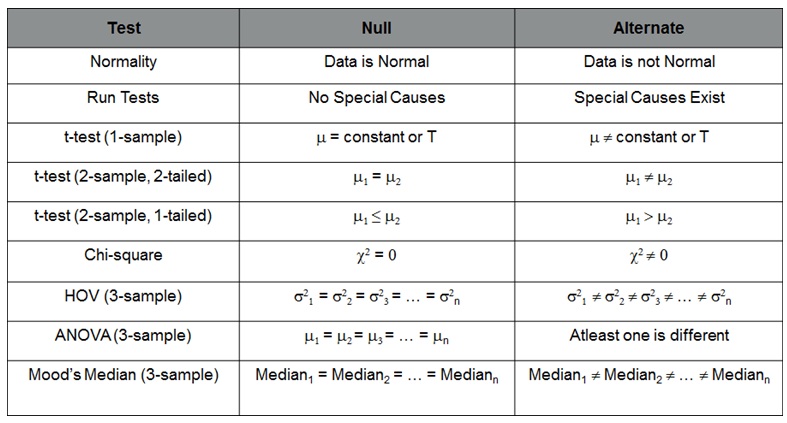
Six Sigma Hypothesis Test – Null and Alternate Summary
What is P-Value in Six Sigma?
In the realm of Six Sigma, understanding the significance of P-value in hypothesis testing is paramount. P-value, or probability value, serves as a crucial metric in assessing the validity of test results derived from sample data. In essence, it quantifies the likelihood of obtaining the observed results or more extreme ones, assuming that the null hypothesis is true. In Six Sigma hypothesis testing, where meticulous measurement and analysis are central, the P-value aids practitioners in drawing informed conclusions from their tests. A smaller P-value indicates stronger evidence against the null hypothesis, prompting a reconsideration of the initial assumptions and potentially leading to a more refined conclusion about the process under examination. As Six Sigma professionals navigate the intricacies of control charts and measurement techniques, the judicious choice and interpretation of P-values play an integral role in ensuring the accuracy and reliability of their conclusions.
In the context of Six Sigma, where the focus is on optimizing processes and minimizing variation, the P-value acts as a pivotal factor in decision-making. It provides a standardized approach for gauging the strength of evidence against the null hypothesis, guiding practitioners in making informed choices based on statistical rigor. As Six Sigma practitioners analyze samples and collect data to assess the efficiency of their processes, the P-value becomes a key element in determining whether the observed results are statistically significant or merely a product of random variation. The integration of P-value analysis into Six Sigma methodologies enhances the precision of conclusions drawn from sample data, empowering professionals to implement targeted improvements and maintain effective control over their processes. In essence, the P-value serves as a compass in the Six Sigma journey, directing practitioners towards sound decision-making and continuous enhancement of quality standards.
The P-Value, short for Probability value, is a statistical metric that quantifies the likelihood of committing a Type I error, denoted as α. This measure serves as a crucial aspect of hypothesis testing, aiding in decision-making processes within the Six Sigma methodology. In practice, the P-Value falls within the range of 0 to 1, with 0 indicating no probability and 1 signifying certainty. In Six Sigma applications, professionals commonly adopt a 5% alpha risk level, denoted by the significance level (α). A P-Value lower than 0.05 suggests a statistical significance that leads to the rejection of the Null hypothesis, providing support for the acceptance of an alternative hypothesis. This careful consideration of alpha risk and P-Values allows practitioners to make informed decisions based on the level of confidence desired in their conclusions.
When working with the P-Value in Six Sigma, the choice of the alpha risk level influences the outcome of hypothesis testing. The standard practice of setting a 5% alpha risk is a common industry norm, striking a balance between sensitivity and reliability. A P-Value below this threshold signifies a statistically significant result, prompting the rejection of the Null hypothesis in favor of the alternative. This nuanced approach ensures that Six Sigma practitioners uphold a rigorous standard in their analyses, leveraging the P-Value as a powerful tool to navigate the complexities of hypothesis testing and make well-informed decisions about the acceptance or rejection of hypotheses.
Six Sigma Hypothesis: Null and Alternative
In Six Sigma data analysis, hypothesis testing is a pivotal process. At its core are two essential components: the null hypothesis (Ho) and the alternative hypothesis (Ha). The null hypothesis acts as a representation of the status quo, indicating that there is no change or improvement resulting from an intervention. On the other hand, the alternative hypothesis presents the intended change, difference, or improvement being tested in a given scenario.
Visualize a scenario in a manufacturing process where you want to test if your product output has improved due to certain changes in the production process. Here, the null hypothesis would state that the average output remains within an acceptable range without any significant improvement, while the alternative hypothesis would assert that the average output has indeed enhanced by implementing specific changes in the production process.
The null and alternative hypotheses work together to frame and guide the statistical testing process, providing a clear outline for exploring the impact of interventions or changes in processes.
For example, in a financial setting where Six Sigma principles are applied to assess loan approval processes, the null hypothesis might posit that there is no significant change in the average time taken for loan approvals. Meanwhile, the alternative hypothesis would assert that there has been a tangible decrease in the average time required for processing loan approvals due to improved operational workflows.
It's crucial to understand that both hypotheses play complementary roles in hypothesis testing. While the null hypothesis anchors the current state or standard processes, the alternative hypothesis serves as a beacon for evaluating potential enhancements or variances resulting from process improvements or changes. When these two hypotheses are utilized effectively, they provide a structured framework for detailed analysis and decision-making.
By comprehending and harnessing these fundamental concepts of null and alternative hypotheses, Six Sigma practitioners can strategically design hypothesis testing frameworks tailored to their specific organizational goals and desired process improvements.
Understanding the intricate groundwork of null and alternative hypotheses seamlessly leads us to explore a suite of powerful tools integral to Six Sigma Hypothesis Testing.
Tools for Six Sigma Hypothesis Testing
When it comes to normality testing, the first step is to determine if your data follows a normal distribution. This is crucial because many statistical tests applied in Six Sigma, such as t-tests and ANOVA, rely on the assumption of normal distribution. One common method for normality testing is the Shapiro-Wilk test, which assesses whether a set of data could have come from a normally distributed population. It's like double-checking that the foundations of your house are solid before you start building on top of it. Ensuring that your data is normally distributed sets the stage for accurate and reliable statistical analysis.
Now, let's talk about the
t-test for comparing means. This tool is used to assess if the means of two groups are statistically different from each other. In the context of Six Sigma, it's crucial for analyzing the impact of process changes. Imagine you're conducting an experiment with two different methods of production – the t-test helps you determine if there's a significant difference between their results. It's like putting your results on trial to see if they hold up under statistical scrutiny.
Moving on to the
Chi-square Test for Independence. This tool assesses whether there is a relationship between two categorical variables. In Six Sigma, it aids in identifying factors affecting process performance. For example, let's say you're investigating the relationship between machine downtime (categorized as high or low) and defect occurrence (categorized as present or absent). The chi-square test can help determine if there's a significant relationship between these two variables. It's like being a detective trying to figure out if two pieces of evidence are related to each other.
And now we come to
Analysis of Variance (ANOVA). ANOVA is used to compare means of three or more groups and is critical in identifying which process interventions yield the best results. Picture having several batches of a product produced using different settings, and you want to know which setting delivers the most consistent quality. ANOVA takes these multiple groups into account and helps you draw conclusions about their statistical differences. It's like being a judge in a cooking competition, deciding which recipe produces the most delicious dish based on the feedback of multiple taste testers.
Each of these tools holds its own significance in hypothesis testing within Six Sigma. By mastering each one, you equip yourself with a robust arsenal for analyzing and drawing conclusions from data with confidence.
As we continue our journey through Six Sigma hypothesis testing, we'll now shift our focus towards examining how differences are analyzed within this framework.
Difference Analysis in Six Sigma Hypothesis Testing
Difference analysis is a critical component of Six Sigma hypothesis testing, particularly when assessing whether changes made to a process have led to a statistically significant improvement. Consider a scenario in a call center setting where managers aim to reduce customer call resolution times. They implement process changes and want to determine if these modifications have resulted in the desired reduction in average call handling time.
To carry out this analysis effectively, it's essential to establish a clear understanding of the state of the process before any changes were made. This involves gathering data on previous call handling times and identifying the average, range, and variation in call resolution times. Once the changes are implemented, new data is collected, and the same statistical measures are obtained for comparison.
The next step involves conducting hypothesis testing by formulating a null hypothesis (Ho) and an alternative hypothesis (Ha). In this context, the null hypothesis would suggest that there has been no significant reduction in average call handling time as a result of the process changes, while the alternative hypothesis would indicate that there has been a significant improvement.
For instance, if the initial average call handling time was 10 minutes with a standard deviation of 2 minutes, and after implementing changes, the new average call handling time is found to be 8 minutes with a standard deviation of 1.5 minutes, the Six Sigma team can then utilize hypothesis testing to determine whether this difference is statistically significant and not due to random variation.
Applying a t-test for comparing means or another suitable hypothesis testing method will help evaluate whether the decrease from 10 minutes to 8 minutes is meaningful or just due to chance. It allows decision-makers to make informed choices based on statistical test inferences rather than relying solely on anecdotal evidence or individual perceptions.
Understanding and applying difference analysis enables Six Sigma practitioners to validate whether process changes have resulted in tangible improvements or are merely due to random fluctuation. This analytical approach provides invaluable insights for making data-driven decisions and driving continuous improvement initiatives within organizations.
Deciding Hypothesis Validity in Six Sigma
Deciding whether to accept or reject a hypothesis in Six Sigma is crucial when evaluating process changes. It's akin to being the detective in a mystery novel, meticulously analyzing the evidence before making a judgment. The crux of this decision-making process lies in examining the p-value and comparing it with the significance level, also known as alpha.
Let's break it down: The p-value indicates the strength of the evidence against the null hypothesis, which is the default assumption that there is no effect or association. A lower p-value means stronger evidence against the null hypothesis. It's like asking, "How likely is it for these results to have occurred if the null hypothesis were true?"
The significance level (alpha) sets the threshold for rejecting the null hypothesis. When we choose a significance level, such as 0.05, we're setting a standard by which we decide whether the evidence is strong enough to reject the null hypothesis and support the alternative.
Imagine you're conducting an experiment to test if a new manufacturing process has reduced defect rates in product assemblies. You collect data and perform statistical analysis, leading to a p-value of 0.03 (less than your chosen alpha value of 0.05). In this scenario, you would reject the null hypothesis and conclude that there is sufficient evidence to support the alternative—that the new process has had a significant impact on reducing defects.
This decision-making process plays a pivotal role in organizational decision-making because it guides leaders in determining whether observed changes are truly beneficial or merely due to chance. In essence, what we are doing here is looking for hard evidence through data analysis—evidence that supports our belief about positive changes resulting from specific actions taken within our processes.
Now that we understand how statistically deciding hypothesis validity works in Six Sigma, let's explore how this crucial step influences organizational decision-making and process improvement strategies.
Enhancing Precision via Reduction of Variation
The concept of variation in Six Sigma is vital as it directly impacts the consistency and quality of outputs. If a process has a high degree of variation, it means there's a lot of inconsistency in how things are done, leading to unpredictable outcomes. Six Sigma aims to reduce this variation, making processes more reliable and consistent. Applying this principle to data analysis, reducing variation paves the way for greater precision and accuracy in understanding the outcomes of a given process.
By reducing variation, businesses can elevate product quality and minimize defects. Let's take an example to make this clearer - think about the manufacturing process for a specific product. If the variation in the process is high, each unit might end up slightly different from the others, leading to inconsistent product quality. However, if the variations are minimized and controlled, each unit will be produced with more uniformity, leading to enhanced quality and reduced defects.
Imagine a scenario where a company produces electronic devices. If the soldering process has too much variation, some boards might have improperly soldered components, leading to defects. By reducing this variation, the company can ensure that each component is consistently and correctly soldered, resulting in fewer defects and higher customer satisfaction.
Ultimately, by incorporating hypothesis testing and reducing variation in processes through Six Sigma methodologies, businesses can significantly enhance their precision in data analysis. This reduction results in higher-quality products, reduced defects, improved customer satisfaction, and ultimately, increased profitability.
Now that we understand the impact of reducing variation on precision, let's explore real-life examples illustrating its effects on data analysis within a Six Sigma context.
Practical Applications of Hypothesis Testing in Six Sigma
Hypothesis testing acts as a detective tool, aiding in uncovering hidden insights and making informed decisions based on data. In the realm of Six Sigma, it is particularly crucial for sifting through vast volumes of information to pinpoint areas that need improvement and validate the impact of process changes. But how does this translate into real-world situations? Let's explore some practical examples.
Consider a scenario where a manufacturing company introduces a new production technique to enhance the quality of their products. They implement this change across multiple plants and want to assess any significant improvements in defect rates. Through hypothesis testing, they can compare the defect rates before and after the intervention to determine if the new technique has had a measurable effect. This allows them to make data-driven decisions about whether to expand the intervention to more facilities or modify the approach.
Furthermore, hypothesis testing comes into play when identifying factors that impact overall performance. For instance, a logistics company may hypothesize that using a particular route for deliveries will significantly reduce transportation costs. By testing this hypothesis with real data, they can quantify the actual impact of this factor and decide whether it justifies altering their current practices.
An airline looking to improve its on-time arrivals might use hypothesis testing to assess if a change in boarding procedures leads to a statistically significant increase in punctuality. They would analyze the data before and after implementing the new procedures to determine if the change had a meaningful impact.
All these scenarios underscore the practical relevance of hypothesis testing in enabling organizations to make informed decisions and allocate resources effectively based on tangible evidence rather than intuition or assumptions.
Now that we've explored some real-world applications of hypothesis testing in Six Sigma, let's delve into its role in evaluating process efficiency and fostering continuous improvement.
The practical applications of hypothesis testing in Six Sigma demonstrate its pivotal role in shaping data-driven decisions across various industries, reinforcing the importance of statistical inference for informed problem-solving.
Frequently Asked Questions about Six Sigma Hypothesis Testing
What are some common types of hypothesis tests used in Six Sigma projects?
Answer: Some common types of hypothesis tests used in Six Sigma projects include t-tests, chi-square tests, and ANOVA tests. T-tests are used to compare the means of two groups, while chi-square tests are used to test the independence of categorical variables. ANOVA tests are employed when comparing means across three or more groups. These hypothesis tests provide statistical evidence to support conclusions and decisions made during Six Sigma projects, ensuring data-driven decision making.
How does hypothesis testing fit into the Six Sigma methodology?
Answer: Hypothesis testing is a fundamental component of the Six Sigma methodology as it helps analyze data to make informed decisions and ensure process improvement. By using statistical methods and tests, hypothesis testing allows Six Sigma practitioners to evaluate if there is a significant difference between observed data and expected results. This enables them to identify the root causes of defects or variations in processes, prioritize improvement opportunities, and validate the effectiveness of implemented changes. With its focus on data-driven decision-making, hypothesis testing plays a crucial role in achieving Six Sigma's goal of reducing variability and improving quality.
How do you determine the significance level and power of a hypothesis test in Six Sigma?
Answer: The significance level in a hypothesis test in Six Sigma is typically determined by setting a threshold, commonly α = 0.05, which represents the maximum acceptable probability of making a Type I error (rejecting a true null hypothesis). Power, on the other hand, is calculated as the probability of correctly rejecting a false null hypothesis, and depends on factors such as sample size, effect size, and variability of data. Increasing the sample size generally increases power, and a comprehensive statistical analysis can be conducted to determine the desired sample size for a given power level.
What are some practical examples or case studies where hypothesis testing has been applied successfully in a Six Sigma project?
Answer:Some practical examples where hypothesis testing has been successfully applied in Six Sigma projects include determining whether a process improvement actually leads to a statistically significant reduction in defects, identifying the root cause of variation in a manufacturing process by comparing different factors, and evaluating the impact of changes in suppliers on product quality. For instance, in a project aimed at reducing defects, hypothesis testing showed that the implemented improvement led to a 40% decrease in defect rates with a p-value of 0.05, indicating statistical significance. In another case study, hypothesis testing revealed that changing suppliers resulted in a significant increase in product quality with a confidence interval of 95%. These examples demonstrate how hypothesis testing helps validate improvements and make data-driven decisions in Six Sigma projects.
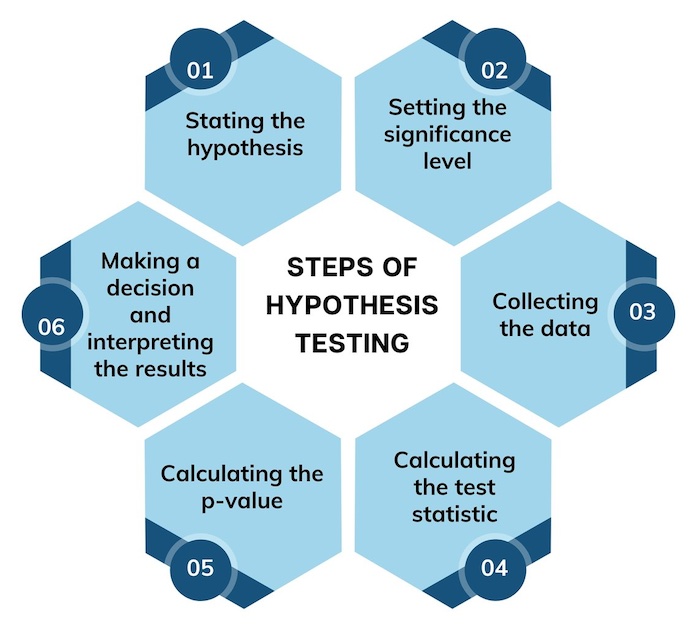
Six Sigma Hypothesis Testing
What are the key steps involved in conducting hypothesis testing in Six Sigma?
Answer: The key steps involved in conducting hypothesis testing in Six Sigma are: 1) Formulating a clear null and alternative hypothesis based on the problem at hand, 2) Collecting relevant data that is representative of the population under study, 3) Choosing an appropriate statistical test to analyze the data, considering factors such as type of data and sample size, 4) Calculating the test statistic and determining the corresponding p-value, which measures the strength of evidence against the null hypothesis, 5) Comparing the p-value with a predetermined significance level (e.g. α=0.05), and 6) Drawing conclusions based on the p-value and making recommendations for process improvement if necessary. These steps ensure a structured approach to hypothesis testing and aid in making data-driven decisions within Six Sigma initiatives.
What is the purpose of hypothesis testing in Six Sigma?
Answer: Hypothesis testing in Six Sigma serves the primary purpose of providing a systematic and data-driven approach to validate or refute assumptions about a process. It enables practitioners to make informed decisions based on statistical evidence, helping identify areas for improvement, validate the effectiveness of implemented changes, and ultimately enhance overall process performance. By employing hypothesis testing, Six Sigma professionals can quantify the impact of process changes and ensure that improvements are not merely coincidental but statistically significant, contributing to the methodology's goal of achieving process excellence and minimizing variation.
In the DMAIC method, which stage identifies with the confirmation and testing the statistical solution?
Answer: The stage in the DMAIC (Define, Measure, Analyze, Improve, Control) method that identifies with the confirmation and testing of the statistical solution is the "Control" phase. In this stage, the focus is on implementing and validating the improvements identified during the earlier phases, ensuring that the process changes are effective and sustainable. Statistical tools are employed to confirm that the improvements lead to the desired outcomes and that the process remains within the defined control limits.
Project y is continuous and x is discrete to validate variance between subgroups. What does this mean?
Answer: When Project Y is continuous and X is discrete to validate variance between subgroups, it means that the response variable (Y) is measured on a continuous scale, while the input variable (X) takes on distinct, non-continuous values. Validating variance between subgroups involves assessing whether there are significant differences in the variability of the continuous response variable across different categories or levels of the discrete input variable.
Which hypothesis test will you perform when the y is continuous normal and x is discrete. What does this this mean?
Answer: When Y is continuous normal and X is discrete, the appropriate hypothesis test to perform is the Analysis of Variance (ANOVA). This test helps determine if there are statistically significant differences in the means of the continuous variable (Y) across the different levels of the discrete variable (X).
What is Sigma Test?
Answer: In the context of Six Sigma, a "Sigma Test" typically refers to assessing process capability, which is a crucial aspect of the methodology. Process capability measures how well a process can produce outputs within specified limits and is often expressed in terms of sigma levels. Sigma levels indicate the standard deviations between the process mean and the nearest specification limit.
A Sigma Test, in this context, involves evaluating whether a process meets the desired sigma level, which corresponds to the level of quality and performance. The higher the sigma level, the more capable and efficient the process is considered. This assessment is vital in Six Sigma as it provides a quantitative measure of process performance and helps identify areas for improvement.
Practitioners use statistical tools such as capability indices, including Cp, Cpk, Pp, and Ppk, to conduct Sigma Tests. These indices compare the spread of process data to the specified tolerance limits, helping determine if the process is capable of meeting customer requirements. A Sigma Test is a fundamental step in the continuous improvement journey of Six Sigma, guiding organizations towards achieving higher levels of quality and efficiency in their processes.
What is beta testing is Six Sigma?
Answer: In the context of Six Sigma, beta testing typically refers to the phase where implemented process improvements are evaluated and tested on a smaller scale before full-scale implementation. It involves assessing the changes in a controlled environment to identify potential issues, gather feedback, and make any necessary adjustments before widespread deployment.
What Null Hypothesis in Six Sigma?
Answer: The null hypothesis in Six Sigma typically asserts that there is no significant difference or improvement in the process under investigation. It serves as the default assumption, and the goal of hypothesis testing is often to gather evidence against this null hypothesis, allowing practitioners to make data-driven decisions regarding process improvements.
Recap of Six Sigma Hypothesis Testing with P-Values
In the world of Six Sigma, hypothesis testing with P-values is a critical component of the methodology, providing a systematic approach to validate assumptions and make informed decisions. The use of P-values allows practitioners to quantify the strength of evidence against the null hypothesis, guiding them in drawing reliable conclusions from sample data. As Six Sigma professionals navigate the intricacies of statistical analysis, control charts, and process improvements, a thorough understanding of hypothesis testing with P-values ensures the accuracy and reliability of their findings.
Mastering Six Sigma hypothesis testing, including the interpretation of P-values, is a skill that can significantly enhance one's ability to drive process improvements and minimize variation. The recap of these testing techniques serves as a valuable reminder of the precision required in decision-making within the Six Sigma framework. Whether you're initiating a project or refining existing processes, the insights gained from comprehending P-values contribute to the success of your continuous improvement initiatives.
To delve deeper into Six Sigma and further enrich your knowledge of hypothesis testing, seize the opportunity to learn from the experts.
Take the next step in your Six Sigma journey by acquiring a free copy of the Six Sigma book from the International Six Sigma Institute. This invaluable resource provides in-depth insights, practical tips, and real-world applications, empowering you to apply Six Sigma principles with confidence. Claim your free copy and elevate your proficiency in the realm of Six Sigma.
 SIXSIGMA INSTITUTE™


