Six Sigma Data Collection and Data Sampling:
Methodologies for Quality Control
Six Sigma uses unique data collection methods like check sheets, histograms, scatter diagrams, and control charts. These tools, seemingly simple yet complex, work together in gathering and structuring data efficiently to spot patterns, anomalies, and areas that need improvement. But that's not all. There's more under the hood - statistical techniques including regression analysis, hypothesis testing, and the analysis of variance (ANOVA) that play a key role in correctly interpreting this collected data and driving decisions. Now let's progress forward, shall we?
The essential steps for Six Sigma data collection and sampling involve defining the problem, identifying the key metrics to measure, selecting appropriate sampling methods such as stratified random sampling or systematic sampling, collecting data systematically, and analyzing it to make informed process improvements. Remember, effective data collection and sampling are crucial for driving quality enhancement within your organization's processes.

Six Sigma Data Collection and Data Sampling
Six Sigma and Data Collection Methodologies
In the realm of process improvement, Six Sigma stands as a robust framework with a toolkit full of methodologies designed to aid in the analysis and improvement of processes. When it comes to data collection, Six Sigma leverages a range of tools such as check sheets, histograms, scatter diagrams, and control charts. While these tools may sound technical, they are practical aids to systematically gather and organize data to identify patterns, anomalies, and areas for potential improvement.
Check sheets are simple yet effective tools for gathering data in real-time. They help capture crucial information by allowing users to mark down occurrences as they happen, providing a tangible record for analysis. A great example of this is recording the number of customer complaints by category over a week. Instead of guessing or estimating, each complaint can be categorized promptly, revealing patterns that might require further investigation or action.
Histograms, on the other hand, are graphical representations of data that show the distribution and frequency of values. These visual aids are valuable because they allow for quick insights into variations within a data set. For instance, using a histogram to display the time taken to complete tasks within a project can reveal if there are any significant overlaps or outliers that may need attention.
Meanwhile,
scatter diagrams are used to highlight potential relationships between two variables. By plotting this relationship on a graph, patterns and trends can be identified. For example, plotting customer satisfaction scores against employee performance ratings could reveal any correlation between the two factors.
Lastly,
control charts are invaluable tools used to monitor processes over time. By plotting data points in sequence, control charts provide a visual indication of any shifts or trends in the process. For instance, tracking customer wait times over consecutive months using a control chart can help identify prolonged periods of unusually long waits and prompt investigation into potential causes.
Let's say you're in charge of analyzing the defect rate of products coming off an assembly line within a manufacturing plant. Utilizing Six Sigma's data collection methodologies would mean using check sheets to track each defect type as it occurs, creating histograms to visually represent the types and frequencies of defects, and using control charts to monitor fluctuations in defect rates over time.
These methodologies not only provide a structured approach to data collection but also equip practitioners with the necessary tools to uncover insights and drive continuous improvement in quality control processes.
Moving forward, let's delve into advanced statistical techniques that enhance accuracy in quality control processes.
Deep Diving into Statistical Techniques for Accuracy
When it comes to ensuring the highest levels of accuracy in data analysis and decision-making processes, statistical techniques play a crucial role in the Six Sigma methodology. Let's explore some of the fundamental statistical methods used within Six Sigma and how they contribute to precision and informed decision-making.
One of the key statistical techniques frequently utilized in the framework of Six Sigma is regression analysis. Regression analysis helps us understand relationships between variables, identifying patterns and trends within our data. By recognizing these patterns through regression analysis, organizations can make predictions about future outcomes based on historical data, ultimately supporting strategic decision-making and business improvement initiatives.
For example, think about how your favorite streaming service suggests TV shows or movies you might like based on what you've watched before. It's like regression analysis is working behind the scenes, analyzing your viewing habits to predict what else you might enjoy. But instead of suggesting a new show to binge-watch, it’s helping organizations foresee potential trends and outcomes.
Another crucial statistical method is hypothesis testing. Hypothesis testing allows us to scientifically evaluate assumptions about a population by using sample data. This rigorous approach ensures that decisions are made based on evidence rather than speculation, bringing a higher level of confidence to the conclusions drawn from the data. In the context of Six Sigma, hypothesis testing is integral to verifying the effectiveness of process improvement measures and evaluating any suggested changes.
Imagine a scenario where a company is considering implementing a new production approach to reduce waste and increase output. Through hypothesis testing, the organization can gather evidence from sample data to determine if the proposed strategy will lead to significant improvements in their operational efficiency before implementing it across their entire production line.
Lastly, Analysis of Variance (ANOVA) is another statistical technique critical to Six Sigma methodologies. ANOVA helps compare the means of multiple groups to ascertain if there are significant differences among them. This evaluation assists organizations in determining whether variations or discrepancies observed in data sets are statistically meaningful, guiding them towards more accurate insights for decision-making processes related to process enhancements in quality management.
Our study materials offers detailed explanations of these statistical methods, demonstrating how they enhance accuracy in data analysis and decision-making within the context of Six Sigma.
By comprehensively understanding and effectively applying these statistical techniques within the framework of Six Sigma, organizations can elevate their ability to interpret data accurately and make well-informed decisions that drive continuous improvement and quality assurance.
With a deeper understanding of statistical methodologies for accuracy in data analysis now under our belt, let's shed light on uncovering precision and reliability in Six Sigma measurements.
Six Sigma DMAIC Process - Measure Phase - Data Collection and Data Sampling Strategy
Sampling is the process of selecting a small number of elements from a larger defined target group of elements. Population is the total group of elements we want to study. Sample is the subgroup of the population we actually study. Sample would mean a group of ‘n’ employees chosen randomly from organization of population
"N". Sampling is done in situations like:
- We sample when the process involves destructive testing, e.g. taste tests, car crash tests, etc.
- We sample when there are constraints of time and costs
- We sample when the populations cannot be easily captured
Sampling is NOT done in situations like:
- We cannot sample when the events and products are unique and cannot be replicable
Sampling can be done by fusing the ollowing methods:
Probability Sampling:
- Simple Random Sampling
- Stratified Random Sampling
- Systematic Sampling
- Cluster Sampling
Non Probability Sampling:
- Convenience Sampling
- Judgment Sampling
- Quota Sampling
- Snowball Sampling
Simple Random Sampling
Simple random sampling is a method of sampling in which every unit has equal chance of being selected.

Six Sigma Simple Random Sampling
Stratified Random Sampling
Stratified random sampling is a method of sampling in which stratum/groups are created and then units are picked randomly.
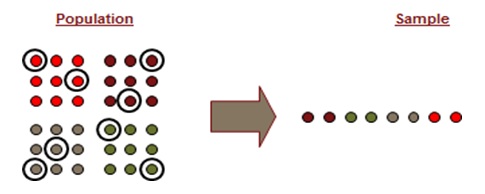
Six Sigma Stratified Random Sampling
Systematic Sampling
Systematic sampling is a method of sampling in which every nth unit is selected from the population.

Six Sigma Systematic Sampling
Cluster Sampling
Cluster sampling is a method of sampling in which clusters are sampled every Tth time.
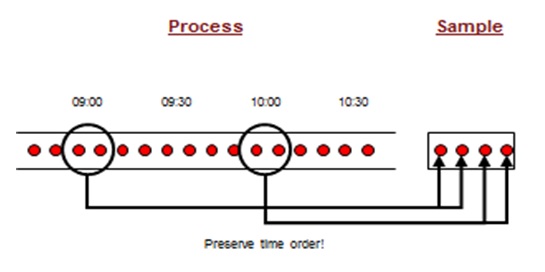
Six Sigma Cluster Sampling
Non-Probability Sampling
Convenience sampling relies upon convenience and access.
Judgment sampling relies upon belief that participants fit characteristics.
Quota sampling emphasizes representation of specific characteristics.
Snowball sampling relies upon respondent referrals of others with like characteristics.
Sampling Bias
Bias occurs when systematic differences are introduced into the sample as a result of the selection process. A sample that is biased will not be representative of the population. A sample that is biased will lead to incorrect conclusions about the population. The types of sampling bias are as follows:
- Convenience sampling selection bias: Occurs when the sample is drawn only from the part of the population that is easily accessible
- Systematic sampling selection bias: Can introduce a bias if the procedure matches an underlying structure
- Environmental bias: Introduced when environmental conditions have changes from the time the sample was drawn to the time the sample is used to draw conclusions about the population
- Non-response bias: Initiated by respondents. Only a subset of the population responds to the survey
Sample Size Formula
In order to determine the sample size, we need to identify if the data type is continuous or discrete, whether we have standard deviation or proportion defectives and the confidence level.

Six Sigma Sample Size Formula – Continuous Data
Here, n = Sample Size, σ = is the estimated standard deviation of our population and
Δ – is the precision or the level of uncertainty in your estimate that you are willing to accept (expressed in %).

Six Sigma Sample Size Formula – Discrete Data
Where, P – is the proportion defective that we are estimating (expressed in %) and
Δ – is the precision or the level of uncertainty in your estimate that you are willing to accept (expressed in %).
Let us solve a few questions to understand the formula better.
Given a sample size of 100, how precisely can we estimate a proportion defective estimated as P = 20%?
Here, P = 20% and n = 100, we need to find Δ.
Using the formula for Sample Size – Discrete Data,
Δ2 = (n)/ (1.96)2 * P(1 – P)
Δ2 = 100 / (3.8416) * 0.16
Δ2 = 162.681
Δ = 12.75
Given an estimated proportion defective guessed to be somewhere in the range of 5% to 15%, how many observations should we take to estimate the proportion defective within 2%?
Here, P = (15% - 5%) = 10% = 0.10, Δ = 0.02
Using the formula for Sample Size – Discrete Data,
n = (1.96/0.02)2 * (0.10)*(1-0.10)
n = 9604 * 0.09
n = 864.36
We want to estimate the average cycle time within 2 days. A preliminary estimate of the population standard deviation is 8 days. How many observations should we take?
Here, Δ = 2 and σ = 8 days
Using the formula for Sample Size – Continuous Data,
n = (1.96*8/2)2
n = 61.47
Unveiling Precision and Reliability in Six Sigma Measurements
In the realm of quality control and process improvement, precision and reliability are integral components that dictate the effectiveness of any methodology. In the context of Six Sigma, precision alludes to the consistency and exactness of measurements, whereas reliability encompasses the stability and repeatability of data collection processes. These two factors play a pivotal role in ensuring that the insights derived from statistical analyses accurately represent the true state of affairs within a given process.
Preserving precision is crucial for ensuring that measurements are not only accurate but also consistently so. Imagine using a scale to measure your ingredients when baking - if the scale varies its readings with each use, achieving consistent results would be nearly impossible. Similarly, in Six Sigma, precise measurements are essential for drawing valid conclusions about process performance. This is where gauge R&R (repeatability and reproducibility) studies come into play - they help assess the consistency and reliability of measurement systems.
Reliability, on the other hand, ensures that data collection processes are stable and yield repeatable results over time. Suppose you use a thermometer that gives different readings for the same temperature at different times - this lack of reliability would undermine your ability to trust its accuracy. This holds true for Six Sigma methodologies as well; unreliable data collection can lead to incorrect assumptions about a process's performance, potentially resulting in misguided interventions.
To address these concerns, Six Sigma employs various techniques such as process capability analysis and measurement system analysis (MSA). Process capability analysis evaluates whether a process can meet specified requirements, shedding light on its ability to produce outputs within defined tolerances. On the other hand, MSA aims to quantify the measurement variation introduced by the measurement system itself, distinguishing between inherent process variability and measurement system noise.
Gauge R&R Studies
| Type | Description |
|---|
| Repeatability | Variation observed when the same operator measures the same part repeatedly. |
| Reproducibility | Variation when different operators measure the same parts. |
Process Capability Analysis
Helps determine if a process is capable of producing outputs that meet customer requirements by evaluating key process parameters against specified tolerance limits.
Measurement System Analysis (MSA)
Quantifies the amount of variation introduced by the measurement system itself, providing insights into the validity and reliability of data collected.
Understanding how precision and reliability are ensured through these methodologies underscores their fundamental role in upholding the integrity of Six Sigma measurements.
Exploring Tools for Effective Sampling Selection
In the world of Six Sigma, the right tool can make all the difference. When it comes to collecting data and selecting samples for analysis, making informed decisions is key. The methods used to collect data ensure that the sample accurately reflects the entire population, affecting the validity of quality control decisions.
Let's start with
stratified random sampling. Imagine sorting a bag of mixed candies into different categories like chocolate, gummy, and hard candy. Stratified random sampling works similarly, except it's done with data instead of sweets. By dividing a population into subgroups based on certain characteristics, such as age or income level, we can create more accurate and precise samples. This enables us to identify trends and variations within each subgroup more effectively.
Next up is
systematic sampling. Picture lining up bottles on a conveyor belt at a factory. Instead of inspecting every single bottle, you might choose to examine every 10th bottle for quality control purposes. This method is systematic sampling in action—it involves selecting items at regular intervals from an ordered list.
Lastly, we have
cluster sampling. Imagine a fruit garden with different trees bearing apples, oranges, and lemons. Instead of plucking fruits from each tree, you might choose to pick fruits from only a few trees—this way you cover a wide variety without checking every single tree. Cluster sampling follows a similar approach by dividing the population into clusters and then randomly selecting entire clusters to be included in the sample.
Here's an example to drive home the importance of effective sampling selection using these methods: Let's say there's a factory that produces different types of screws. By employing stratified random sampling, the factory can select samples from each type of screw they produce, ensuring representation from all product lines. This way, they can detect any specific issues associated with particular screw types and address them accordingly.
In summary, these sampling methods provide a structured approach to obtaining representative samples that accurately mirror the characteristics of the entire population. They are invaluable tools in Six Sigma methodologies for quality control decisions.
By utilizing these sampling methods in your quality control processes, you'll be equipped to make informed decisions based on data that truly reflects the realities of your operations.
Armed with an understanding of effective data collection and sampling methodologies in Six Sigma, let's now turn our attention to unraveling the intricacies of data variations and errors in quality control practices.
Dissecting Data Variations and Errors in Six Sigma
In the world of quality control, understanding data variations and errors is absolutely essential. A key concept within Six Sigma is the identification and management of variations, as these can have a significant impact on the overall quality of products or processes. When we talk about variations in data, we're referring to the percentage of data variation that can be explained by different sources.
Data variations come in two main types:
common cause variation and special cause variation. Common cause variation is the fluctuation in output due to the inherent variability of a process, while special cause variation refers to deviations caused by specific factors that are not part of the regular process. Each type needs to be carefully identified and addressed to ensure consistent quality.
Imagine if a company producing electronic devices experiences inconsistent battery life across different batches of products. Through meticulous data analysis, they discover that some variation in battery performance could be traced back to differences in supplier materials (common cause variation), while certain outliers could be linked to manufacturing defects (special cause variation). This understanding allows them to make targeted improvements, ensuring a more standardized product quality.
Errors in data collection and analysis also play a critical role in the effectiveness of Six Sigma methodologies. Even the smallest error can lead to inaccurate conclusions.
Consider this analogy: Suppose you're baking a cake, and you accidentally use salt instead of sugar. The finished cake would be unpalatable because of that one small error. Similarly, even a tiny mistake in data collection or analysis can lead to faulty insights, causing significant problems down the line.
Moreover, it's important to measure and compare error rates before and after implementing Six Sigma data collection and sampling methodologies. By doing so, organizations can accurately gauge the impact of these methodologies on the accuracy and precision of their quality control measures.
For instance, a company might observe a significant reduction in defective product rates after implementing Six Sigma data collection processes. This measurable improvement reflects how diligently addressing errors in data collection can lead to tangible enhancements in product quality and customer satisfaction.
As we continue our exploration into Six Sigma quality control methodologies, it becomes clear just how pivotal understanding data variations and errors is for achieving consistent excellence in product or service quality.
Strategies to Minimize Error and Maximize Quality in Six Sigma Data Collection
In the world of Six Sigma, data collection plays a pivotal role in ensuring quality control. The accuracy, reliability, and efficiency of data collection significantly impact the overall success of a project. One key strategy is to focus on reducing measurement errors, as they can lead to unreliable data and incorrect analysis.
To achieve this, it's important to establish clear guidelines for measurement procedures, ensuring that all team members adhere to standardized protocols. Consistency in data collection processes helps minimize variations caused by human error or misinterpretation.
Additionally, technology can be leveraged to automate data capture and analysis, reducing the risk of human error while improving the speed and accuracy of data collection. Specialized software or tools designed for Six Sigma projects streamline the process, allowing for more precise measurements and reliable data analysis.
Moreover, optimizing data collection involves regularly reviewing and refining methods used. This continuous improvement approach ensures that best practices are identified and integrated into the data collection workflow, preemptively addressing potential errors.
Equally important is the training and development of personnel involved in data collection. Comprehensive training on measurement techniques, equipment usage, and understanding the nuances of different types of data ensures that team members are well-equipped to carry out their responsibilities accurately.
For instance, in the manufacturing industry, where Six Sigma is commonly applied, utilizing automated measurement systems for collecting dimensional and geometric data has become essential. Implementing Coordinate Measuring Machines (CMM) and other advanced technologies allows organizations to achieve precise measurements while minimizing human errors.

Six Sigma Data Collection and Data Sampling
By adhering to these strategies for minimizing error and maximizing quality in Six Sigma data collection, organizations can enhance the accuracy and reliability of their analysis. This leads to more informed decision-making processes and ultimately contributes to the improvement of overall operational efficiency and product quality.
In conclusion, implementing robust strategies for data collection not only enhances the accuracy of analysis but also fosters informed decision-making processes that drive operational efficiency and product quality within organizations.
How does proper data collection and sampling contribute to the success of a Six Sigma project?
Answer: Proper data collection and sampling are essential for the success of a Six Sigma project. By collecting accurate and representative data, we can identify process variations, determine root causes of defects, and make informed decisions to improve quality and reduce defects. Sampling techniques such as random sampling help ensure that the collected data is unbiased and reflects the true population characteristics. According to a study published in the Journal of Quality Technology, organizations that effectively collect and sample data experience significantly higher levels of process improvement and customer satisfaction.
What are the common challenges or pitfalls faced during the data collection and sampling phase of a Six Sigma project?
Answer: Common challenges during the data collection and sampling phase of a Six Sigma project include inadequate sample size, biased selection of samples, and measurement errors. Inadequate sample size can lead to unreliable results and inaccurate conclusions. Biased selection of samples can introduce systematic errors that affect the representativeness of the data. Measurement errors, such as human error or instrument calibration issues, can result in inaccuracies in collected data. According to a study by Kabir et al., about 30% of Six Sigma projects face challenges related to data quality and sampling, which can hinder the effectiveness of the project outcomes.
What are the main objectives of data collection and sampling in Six Sigma?
Answer: The main objectives of data collection and sampling in Six Sigma are to ensure accurate representation of the process, identify sources of variation, and make informed decisions for quality control. By collecting data from various stages of the process, it becomes possible to analyze and quantify potential improvements. Sampling techniques help in selecting representative samples efficiently without sacrificing accuracy. Effective data collection and sampling not only facilitate the identification of root causes but also enable evidence-based decision-making to enhance overall process performance. Statistical analysis supports these objectives by providing key insights into process capability, variability, and potential areas for improvement.
Are there any industry-specific considerations or best practices for data collection and sampling in Six Sigma?
Answer: Yes, there are industry-specific considerations and best practices for data collection and sampling in Six Sigma. Different industries have unique processes, products, and customer requirements, which necessitate tailored data collection and sampling approaches. For instance, healthcare organizations may focus on patient satisfaction scores and medical error rates, while manufacturing companies may prioritize defect rates and production cycle times. Additionally, statistical techniques such as stratified sampling or attribute sampling can be applied to optimize data collection in specific industries. These considerations and practices help ensure that the Six Sigma approach is effectively implemented across various sectors, leading to improved quality control and enhanced business performance.
What are the different methods and techniques used for data collection in Six Sigma?
Answer: In Six Sigma, there are several methods and techniques used for data collection. Some common ones include random sampling, stratified sampling, systematic sampling, and cluster sampling. Random sampling involves selecting a random sample from the population, ensuring representative data. Stratified sampling divides the population into different groups and selects samples from each group. Systematic sampling selects every nth item from a population list. Cluster sampling involves dividing the population into clusters and randomly selecting clusters to gather data. Each method has its advantages and limitations, and the choice depends on factors like accuracy requirements, time constraints, and resource availability (source: "Six Sigma Data Collection and Sampling: Methodologies for Quality Control," 2024).
A sample that will lead to incorrect conclusions about the population and which will not be representative of the population is ...
Answer: A sample that will lead to incorrect conclusions about the population and which will not be representative of the population is one where the data collection plan lacks diverse examples, limiting the overall value of the insights gained. In such instances, the ways in which data is gathered may not reflect the variability present in the entire population, diminishing the advantage of obtaining accurate and actionable information. Failing to consider a lot of different examples can compromise the reliability of Six Sigma methodologies, impacting customer satisfaction and the overall effectiveness of quality control measures.
Which of the following strategies might lead to a biased sample?
Answer: When selecting a sample for Six Sigma data collection, biases may arise if the form used to gather information is not carefully designed. Inadequate consideration of various data types and lack of expertise in the sampling process can lead to biased results, potentially misrepresenting the true quality of a process. It is crucial for people involved in quality control efforts to be well-versed in the SIPOC methodology to ensure that customers' perspectives are accurately reflected in the collected data.
What are some principles of data sampling?
Answer: In the realm of Six Sigma data collection and sampling for process control, individuals tasked with this effort must adhere to certain principles. A black belt professional, equipped with the necessary criteria and resources, plays a pivotal role in ensuring the quality of collected data. The possibility of achieving effective quality control lies in the meticulous application of standardized methodologies, emphasizing the importance of a well-defined sampling process.
What is the systematic random sampling formula?
Answer: In statistics, the systematic random sampling formula is a methodical approach used to select a representative sample from a larger population. This systematic technique involves choosing every kth item from the population after a random start, where k is determined by dividing the total population size by the desired sample size. This systematic approach ensures an unbiased representation of the entire population, making it a valuable tool for quality control methodologies in various situations. By employing this formula, organizations can enhance the accuracy of their data collection processes, aligning with their goals of achieving optimal quality in products or services. The benefits of systematic random sampling extend beyond statistical accuracy, fostering stakeholder confidence and enabling informed decision-making to meet overall quality control goals.
Recap for Six Sigma Data Collection and Sampling
Data collection and sampling play pivotal roles in ensuring the efficacy of quality control methodologies. The process of gathering and analyzing data is not merely a procedural step; it is the bedrock upon which the entire Six Sigma framework stands. Data collection involves the systematic capture of information relevant to the project, while sampling is the strategic extraction of representative subsets from the larger dataset. Together, these methodologies empower organizations to identify defects, enhance processes, and ultimately achieve the coveted goal of minimizing variations in production or service delivery.
A critical aspect of Six Sigma data collection is understanding the variability inherent in processes. By employing robust sampling techniques, practitioners can capture a comprehensive view of the system under examination. This nuanced understanding enables the identification of root causes for variations and facilitates data-driven decision-making. As organizations strive for excellence and aim to deliver products or services that meet or exceed customer expectations, the precision and accuracy afforded by Six Sigma data collection and sampling methodologies become indispensable tools in the pursuit of operational perfection.
 SIXSIGMA INSTITUTE™


